
Expectations are funny things. There is no universal standard for them. We can both look at the same set of facts and data about the world but develop wildly different expectations from them. I may look at a lineup and expect it to contend. You may look at the same lineup and expect it to struggle.
I have developed my own methods of defining expectations. Long time readers will know that it is based on long-term average performance per seed. If you want to read more detail about the method, you can find it here.
A pro to this method is that the results are stable over time. For the last twelve tournaments the #1 seeds have outperformed the #2 seeds. In 13 of the last 16 tournaments the #2 seeds have outperformed the #3 seeds. For the top #8 seeds, where the lion’s share of the points are scored, it is true over 70% of the time.
A con to this approach is that every fan thinks some combination of “but my guys are special and different” and “but the committee really got the seeding wrong on my guys”. I have no solution for this, so I will just stick with my method. A more meaningful con is that nothing happens every time. The averages are built from individual results, and those results may vary (they will vary). This makes the model less useful at very granular levels like predicting will wrestler A beat wrestler B?.
But it still has a lot of use at broader levels like the team level and at the tournament level. So that is where we will use it to build and examine our expectations.
Planting Seeds
Everyone know seeds matter.
Unless of course you get a bad seed. Then your coach will convince you that seeds don’t matter. But for our purposes they do. Using the expected points by seed that the model spits out and applying it to each team’s group of seeds we can say what we expect every team to score if they perform like the average seed.
Then we can compare that to how the team actually performed to make statements about over-performance and under-performance.
The Over
The teams that most over-performed their seeds based expectations are:
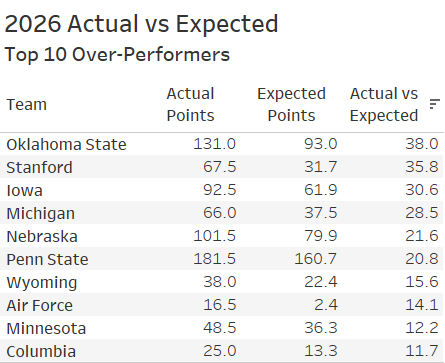
No real surprises here. Oklahoma State balled out. Stanford more than doubled their seeds-based expectations. Iowa shocked the world (and some on its own forum). Michigan, Nebraska, and Penn State all put up more than a 20 margin to their expectations. And anyone who entered my Dark Horse Derby on the on3 message boards is well aware of the stronger than expected performances of Wyoming, Air Force, Minnesota, and Columbia wrestlers.
The Under
And then there are those who have their regrets about how the tournament unfolded:
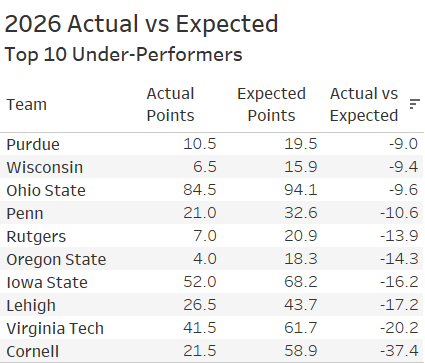
Whisper the question softly, but what happened in the Finger Lakes this year? Cornell put up less than half of their expected points. Unfortunately, this ranks among the worst misses in NCAA tournament history (discussed here – using a slightly different criteria). Virginia Tech, Lehigh, and….well, you can read the rest of the list.
The most interesting one to me was Ohio State. A lot of online ink has been spilled over their performance and maybe it is warranted, but this analysis suggests it wasn’t THAT bad. Sure they dropped from expected second to actual fifth, but that has as much, or more, to do with how Oklahoma State, Nebraska, and Iowa over-performed as it does with how the Buckeyes performed.
It Is About The Journey
But there is another way to look at this. The seeds represent the culmination of the regular season and the conference tournaments. They are the end of the journey (before the final journey). What about the path each team took to get there? Wouldn’t that have an impact on expectations too?
Surely a team that started out with poor prospects, rallied into the tournament and then beat that expectation would feel pretty good about itself even if there was no trophy to memorialize the season. Let’s use Columbia as an example.
At no point during the season prior to the seeds were the Lions expected to score double digit points in the tournament. But as we saw above once the seeds came out they were expected to score 13.3 points – that was their high water mark for the season. And then the tournament happened. At 25 points they nearly doubled their high water mark for expectations.
So how did others perform against their high water marks?
Opposites Attract
For this next exercise we look at the actual points scored, compare them to the seeds-based expected points – just as we did above – but we add a wrinkle. Using the weekly rankings from Flo we calculate the weekly expected points for each team and use the maximum of the weekly expected points as the High Water Mark.
For example, Illinois beat their seeds based expectations of 27.6 points by 0.4 points. Pretty good. But back on December 1st their prospects were much higher. Then their expected points were 47.1 (they maintained near that level until the conference tournie). If an Illini fan spent all season thinking upper 40’s were what they should expect for a team score they might not find 28 points quite so satisfying.
The high water mark is when the fans were at their happiest and their expectations were at their highest. It can be hard for fans to reformulate expectations. We all long for the good old days when our bellies were flat, the hair was on the top of our heads, and our favorite team was humming along smoothly. If those expectations are not met even a good tournament can feel hollow.
The teams that polarize opinions the most among their fan base are the ones that finish somewhere between the low expectations their seeds engendered and the high expectations their prior rankings created.
To find those teams we look at the teams that out-performed their seeds (positive Actual vs Expected), but under-performed the high water mark (negative Actual vs High Water Mark).
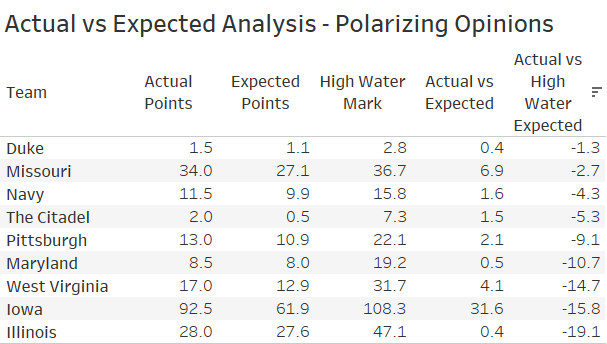
Surprisingly, there were only nine such teams. But one team stands out on that list.
Iowa started the year in expected third place and even made a few brief appearances in expected second place on November 24. Their high water mark for expected points happened with the December 15 Flo rankings. On that date, Iowa was in a dead heat with Penn State and Ohio State for first. Now everyone knows that Josh Barr had yet to return from injury and the freshmen on multiple teams had not taken their “true” spot in the rankings yet, making the PSU total an illusion. But Iowa was still expected to score 108.3 on its own at that time.
Then some things happened. And expectations for the Hawkeyes dropped over 43% to 61.9 expected points by the time the seeds came out. That total was only good enough for expected sixth – and then just barely, with Virginia Tech 0.2 expected points back in expected seventh.
Then some more things happened. And virtually all of those things were good. Most Iowa wrestlers met or exceeded their seed – some far exceeded. They finished with 7 All-Americans from 9 qualified wrestlers and exceeded their seeds based expectations by a whopping 49%. But they still missed their high water mark by 17%.
The roller coaster ride was complete. From the highs of expected third/second to the lows of expected sixth/seventh they settled in at fourth and took home a team trophy.
But What Did You Expect?
As I stated at the outset, expectations are a funny thing – and a personal thing. Some will have wanted even more out of Penn State and been left a little disappointed in spite of the scoring records set (team points and team bonus points). Stanford fans are likely to be ecstatic with their team’s performance after flying under the radar all year. Oklahoma State is always on the radar, but their performance exceeded all but the most homer-ish expectations leaving a feeling they have arrived again (who says they ever left?).
Comment below.
Have something you want examined?
Reach out at: wrestleknownothing@gmail.com