It is time for introspection and to hand out some grades.
I Go To Extremes
Every year there are outliers. Wrestlers or teams that show up, or not so much. But this year it was maybe a little more so. There just seemed to be more extremes.
With an average of 22.7 points scored, the #1 seed had the second best performance since seeds expanded to 12 per weight in 1979 (at 22.9 points per, 1984 was the best).
The #2 seed had its worst performance ever. And it really wasn’t close. At an average score of 12.25 the next lowest total was 13.9 in 2024. The five year average for #2 seed was 16.5.
The #6 seed was also historically bad (second worst since 1984) while the #7 seed was historically good (best since 1984).
The #11, #15, #18, #20, #27, and #29 also set record points totals – the the last 5 seeds did so over much shorter histories.
In short, we had to navigate some choppy waters this year. Enough with the excuses, now the data.
Every Prediction Is Wrong
But the good ones are right on average.
Below is a graphical comparison by seed of the expected points model (orange line) to the actual points (blue line), and to the binary models (green line) that are used by Flo, Wrestlestat, and Intermat. These comparisons only account for advancement and placement points as Flo and Intermat do not include bonus points. We will discuss Wrestlestat’s bonus points separately.
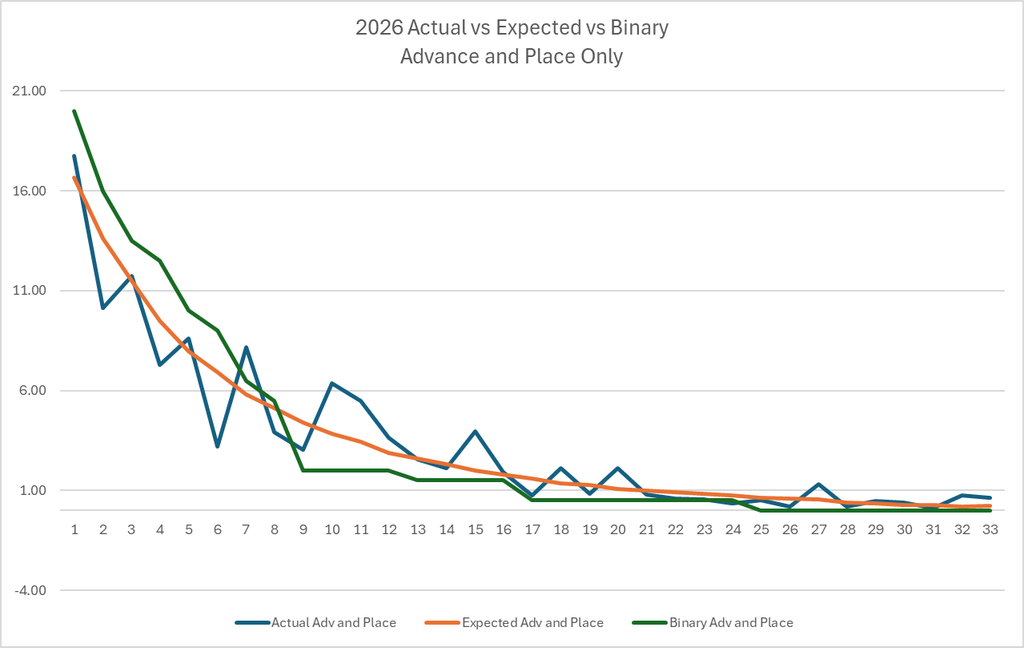
The expected points model is a fitted line based on ten years of historical data. Of course, every year is different – no year is average.
The binary model assumes the wrestlers will finish in the exact order of the rank/seed. However, no bracket has gone according to chalk – ever.
If you stare at that graph long enough you can see the differences. Neither model deals with individual tournament chaos – after all that is what makes it chaotic – but the expected points model has an advantage over the binary model. The binary model tends to overvalue top eight seeds and undervalue everyone else. That was true this year, as it is virtually every year.
Expected vs Binary
All models are wrong, but some are useful. But which is more useful?
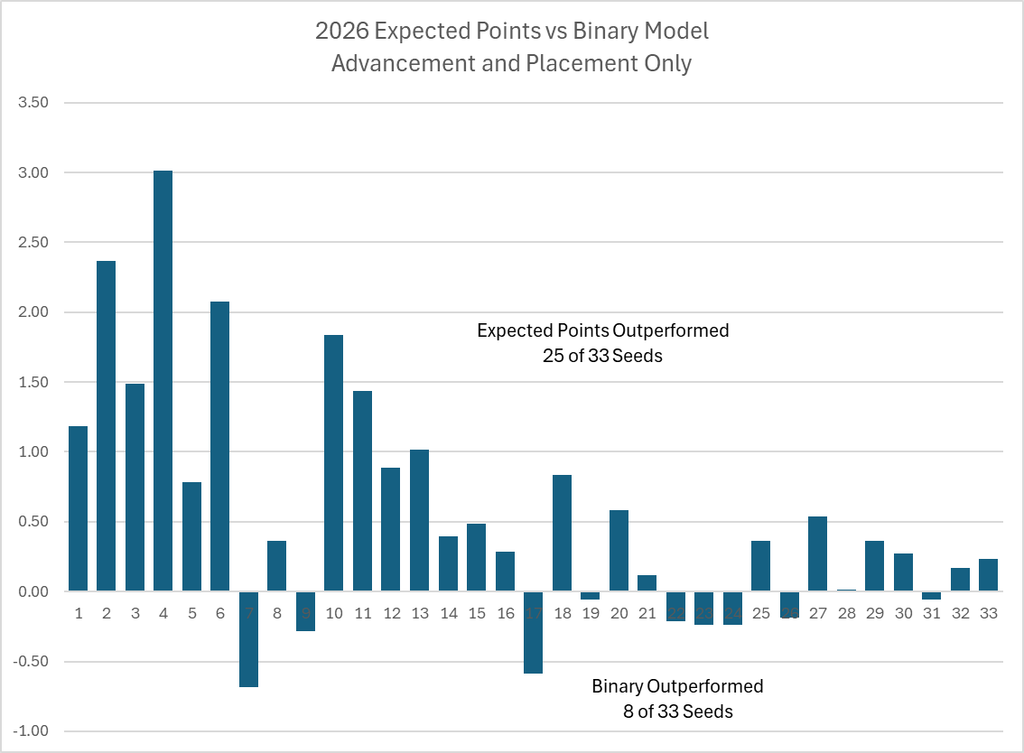
I am happy to report (brag?) that the expected points model outperformed the binary model with a lower sum of absolute differences to actual points (30.9 to 49.5) .
And the expected points model was closer to the actual score at 25 of the 33 seeds. Below is a difference in differences analysis between the models. For each seed the value is the difference between the absolute deviations produced by the respective models.
A positive number means the expected points model was closer to the actual points. A negative number means the binary model was closer to the actual points. Positive and negative do not have any other meaning, though the magnitude does matter for the sum of differences.
Extra Credit
One of the biggest knocks against the binary models is they often do not include an estimate for bonus points. And those extra points mean a lot come tournament time.
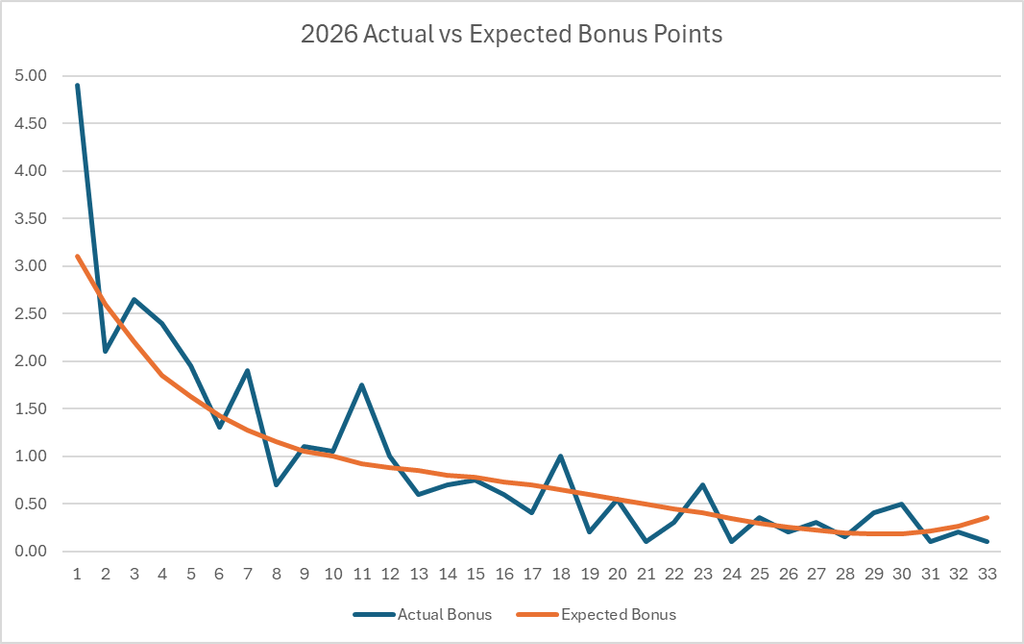
This tournament was a relatively high scoring one for bonus – ranking in the 83rd percentile since 1984. The expected points model expected 286 bonus points for the field, but this tournament delivered 311 of them (+9%). The biggest deviation by far occurred at the #1 seed where the ten wrestlers were just 1 point shy of the record set for #1 seeds in 1984.
With an average of 4.9 bonus points per wrestler these ten men far exceeded the expected 3.1 bonus points per wrestler the model produced. No other seed deviated by a significant amount.
Wrestlestat is the only other service that predicts bonus points. Their model appears to be done at the individual wrestler level rather than at the seed/rank level. For the tournament they projected 174.8 total bonus points – almost 78% less than what occurred. That model needs some work as the lowest total recorded since 1984 was 211.5 in 1995.
With the current bonus point inflation I expect that the expected points model for 2027 will kick out some higher values for bonus points.
Putting It All Together
As mentioned above the expected points model is a fitted line based on historical data. So what if we fit a line to just the 2026 results and compared that to the expected points model. Wouldn’t that be interesting?
For this exercise we will use all points – advancement, placement, and bonus – in our comparison.
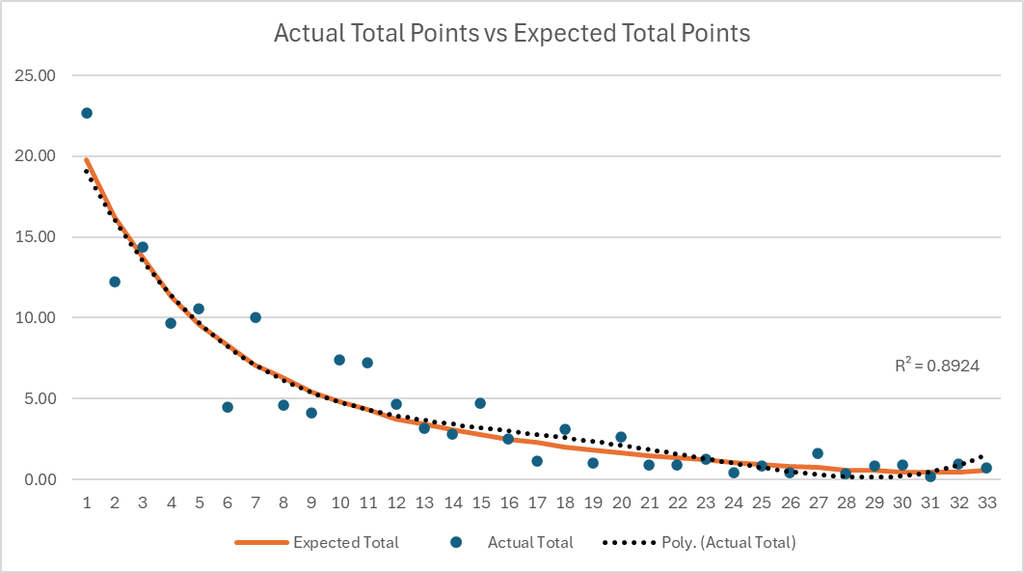
The line fitted through the 2026 actual results looks very similar to the expected points model based off of the prior ten years. And the R2 of the fitted line is not too bad at 0.89 – lets call it close.
But that does not necessarily mean that the 2027 model will be the same as the 2026 model. The line above is a simple fit in one dimension. When the 2027 model is built it will be a fit across a surface with two dimensions (seed and finish). It is a subtle, but important difference.
There Is No Team In I
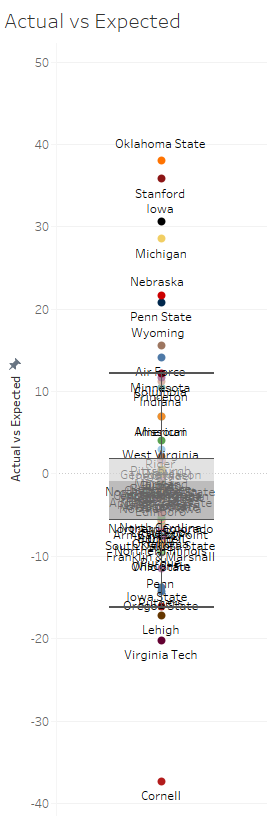
Let’s roll it all up to the team results and see how the model performed.
With 8 of 70 teams firmly in the outlier status, and another 3 near the edge, I would rate it a “meh” to a “not too bad”.
Like every serial offender though, I promise to do better next time….. if you just give me one more chance.
Leave a Reply